Welcome to the last day of the month. Sessions from last week, as every month, showed that contracts were closing, so this week we have to be careful that new contracts do not take the profit from the entire month. Mark Douglas in his book “In a trance of investing” wrote about a frequent case of people who trade on the stock market and stock exchange instruments. He wrote about the fact that the trader works hard all month, and in the last week he loses all his earnings and still suffers a loss. Familiar? Personally, I did not know about such a phenomenon, but sometimes it happened that I wanted this last week to be the best and the market quickly showed who was right.
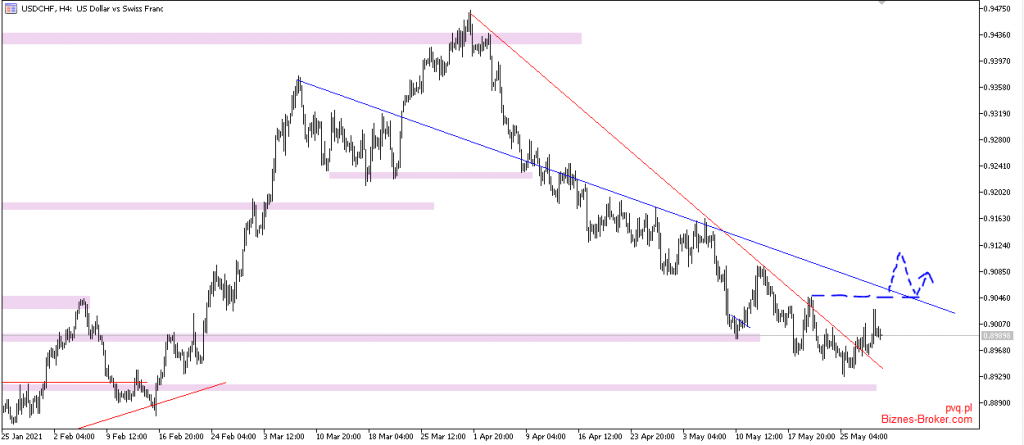
USDCHF
We begin our analysis with the US dollar / Swiss franc currency pair. Tomorrow’s macroeconomic data point to a worse economic situation in Switzerland. GDP is expected at -0.4% and retail sales decline. In the chart, we see the trendline breaking, and the first signal to possible long positions. In the event of a price breakout, an important level is the one marked in the image, then you can try to add the next position on the correction.
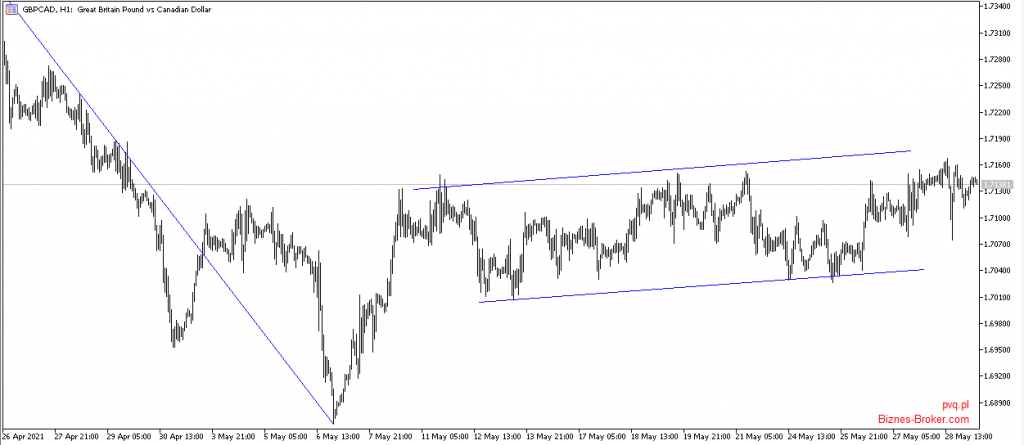
GBPCAD
There hasn’t been much change in the British Pound vs. Canadian chart. You can see that the price remains in the channel all the time so we are waiting for the breakout of the formed formation. Until then, positions concluded inside the channel will be justified, bearing in mind that we expect an increase in this currency pair.
ETHEREUM
The ETH cryptocurrency, just like BitCoin, is in a phase of strong declines. Unfortunately, the volume analysis does not look optimistic, we can see that the increasing volume is mainly related to sales. At the same time, it is worth paying attention to the fact that the overall turnover is quite small so we have to wait for the movement from the market. However, if you’ve been in the crypto market long enough, you should remember how the price of the various stocks behaved in the period we have now … Very strong drops before the holidays and summer period. Big panic because many investors realized profits. Several factors have contributed to this at the moment, but it does not change the fact that we have already seen it. I was buying BTC for 200 USD so that after a month it would cost again as much when everyone said that it was the end of cryptocurrencies.

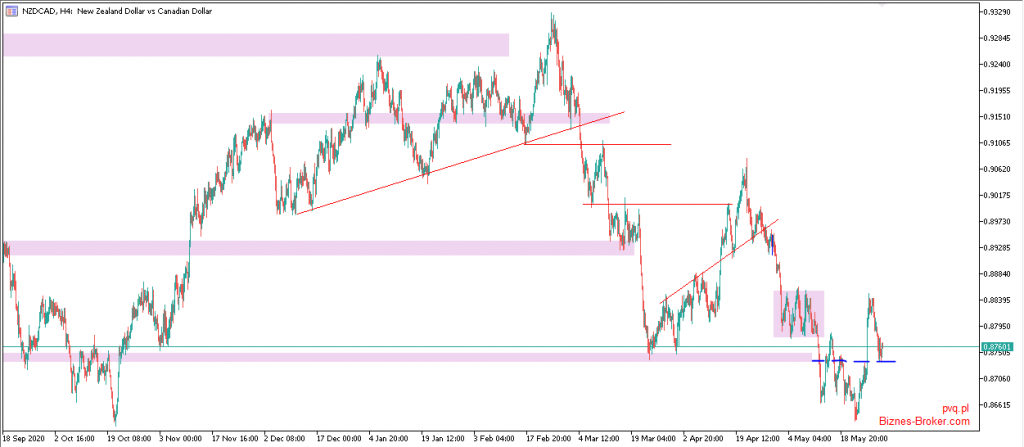
NZDCAD
The chart shows a significant signal of the price rebound that broke the left highs and is currently in the correction phase to the support that I have marked in the image. Unfortunately, we cannot be sure of the direction at the moment. There are two reasons. First, the analysis of the chart shows a rebound and a possible continuation of the upward movement. But the second aspect is the macroeconomic data for Canada, which indicate the expected improvement of the situation in this country, which may have an impact on the further strengthening of the Canadian dollar. By principle; “Play what you see, not what you think” we should enter long positions.
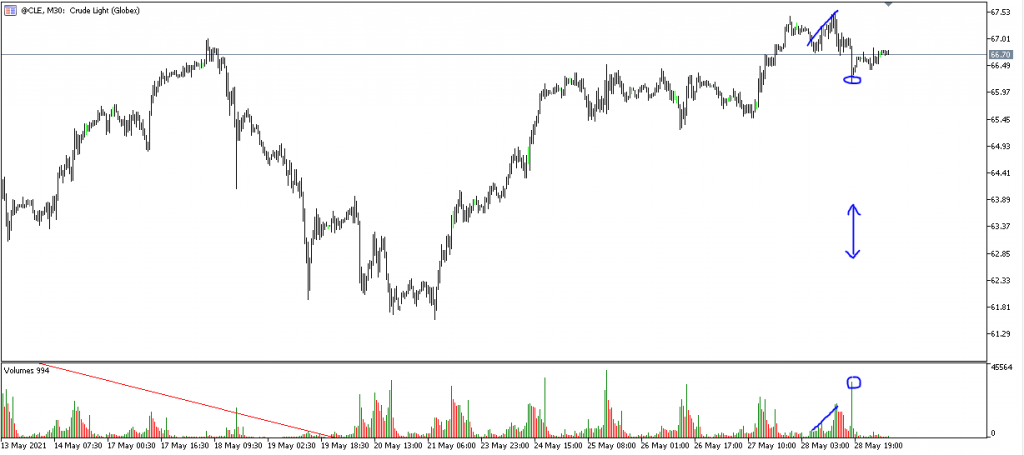
Crude Oil
Looking at the chart, many of you probably think it’s time to correct it. Let’s do a volume analysis and see if it can be so. So far, since our last post on crude oil, the price has gone up as expected, but it hasn’t done 100% of what we wanted. But the market is not a pharmacy, it cannot be everything accurate on a scale. So now let’s see that the situation is still optimistic, which means that during the breakout, the trading volume increases, so there are many people willing to buy the stock. During the downward correction, the volume weakens, and when someone makes a large dump of contracts, a demand side appeared that gathered everything that panicked investors wanted to sell, and those who connected so that the market would not escape them. The result was that a large investor bought everything that was at the price level of USD 66.20 and the price immediately started to rise (probably also activating orders hedging SL short positions)