Read Time:34 Second
BTC
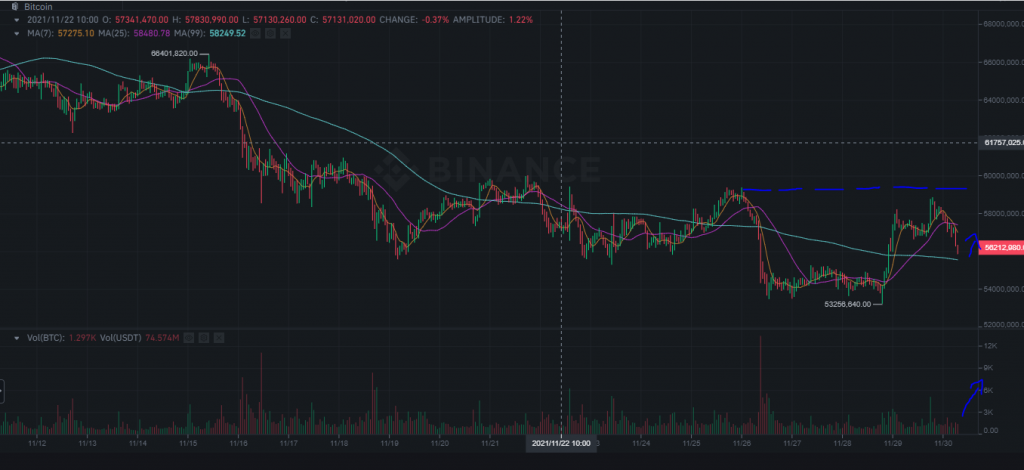
The chart shows the first reaction to the level I wrote about in the first half of this month. Unfortunately, the demand for volume is not visible on the chart, which is not optimistic. Our expectations are for the current resistance level to break as the volume rises, which will mean that buyers are starting to put in more money.
In the image below, I have outlined what exactly is going on. The increase in turnover together with the increase in price and the breakout of the level at which the dotted line is drawn. Unfortunately, we have a downtrend until then and I do not recommend buying BTC before a specific signal.